Frequency Matters
By Suman Gupta
Catchwords/phrases catch on, i.e., their uptake is the starting point for thinking about them.
A few notes follow on the frequencies of usage that characterise catchwords/phrases as such (i.e., their usage-frequencies). (The assumption that words and phrases are units in the same way calls for some unpacking in due course.)
Definitive Features
With catchiness in mind, I have the following as definitive features for catchwords/phrases:
- The connotations with which catchwords/phrases start catching on can usually be traced to a specific social juncture (an ‘origin’). The initiation of catching on is likely to involve the following:
- An existing word/phrase acquires a new sense at a social juncture, which then leads to it catching on in a significant manner over a subsequent time-period (in standard dictionaries, word-senses are enumerated separately, and new word-senses added as they settle).
- A neologism or new phrase-form appears at a social juncture and then catches on in a significant manner over a subsequent time-period (it is more than a ‘nonce’ word/phrase or a context-specific coinage for one-off or occasional purposes).
- ‘Catching on in a significant manner’ means that, starting from that ‘original’ social juncture, catchwords/phrases have steadily growing usage-frequencies over a time-period, extensively (spread across contexts) and/or intensively (within a context). They are to be considered catchwords/phrases for the time-period over which there is steadily growing usage-frequency; they are to be considered catchwords/phrases insofar as such growing usage-frequency is extensive or intensive or both. The relativistic terms are italicised, and may be sharpened as follows:
- Time-period: For a catchword/phrase to be recognised as such, the time-period over which its usage-frequency grows should be sustained enough and yet concentrated enough to become discernible. If the word/phrase were used, for instance, enthusiastically for a day or two in some context and then stopped being used, it cannot be considered discernible as a catchword/phrase (it is in the province of ‘nonce’ words). Equally, if usage of the word/phrase grew in frequency very slowly, with rises and dips, over several decades, then too it cannot be considered discernible as a catchword/phrase.
- Extensive usage: The catchword/phrase has caught on across a range of domains of usage, e.g., across different regions/registers/cultural contexts.
- Intensive usage: The catchword/phrase has caught on in that its usage-frequency is high within domains, e.g., in a specific region/register/cultural context.
- Combinations of extensive and intensive usage: If a catchword/phrase is used both extensively and intensively, it is likely to be a popular catchword/phrase, which may well enter general everyday usage. If the catchword/phrase is used extensively but not particularly intensively, it is likely to be an organizational catchword/phrase, as may be used by academics, businesspeople, bureaucrats, activists, and the like within their circles in different locations. If the catchword/phrase is used intensively but not particularly extensively, it is likely to be an in-group catchword/phrase, as may be used in a school, workplace, or neighbourhood at a specific location.
- In principle, a degree of catchiness of catchwords/phrases should be calculable as a function of the {time-period of steady rise in usage-frequency} and of the {combination of <extensive> and <intensive> usage}.
- When the period of ‘catching on in a significant manner’ ends, the word/phrase in question ceases to be a catchword/phrase. That could mean either diminishing usage-frequency or a levelling of usage-frequency. In descriptive terms, that could indicate that the word/phrase has:
- entered a stable level of everyday or professional or in-group usage (has become ordinary usage in those circles); or
- come to be considered idiomatic (its particular sense is stabilised, but it is understood as linguistically distinctive, perhaps with non-logical implicature); or
- come to be regarded as a cliché (used not so much to state a proposition as to distance from – usually ironically or disparagingly – the statement of such a proposition); or
- become outmoded.
Perceptual Frequency Estimation
Simple recognition appears to be an obvious basis for discerning what is or is not a catchword/phrase. If I ask my colleagues to name five current catchwords/phrases given one or two examples of what I have in mind, they readily come up with a list. (They must be getting fed up with my asking this.) Generally, they do this confidently, unhesitatingly, and without asking searching questions about what catchwords/phrases mean.
Such immediate recognition might be based on rule-of-thumb frequency estimations. If I notice that I am encountering a word/phrase often nowadays in the news media, official documents, popular publications, everyday conversations, etc. I think it is a current catchword/phrase. That is not just because I note this and start using it within my remit, but because I know that each of those occurrences in news media, official documents, etc. are also within the remits of many others like me. Simple recognition is a reasonably robust indication of what we may call perceptual frequency estimation.
Reasonably robust as it is, perceptual frequency estimation is loose enough to make for significant divergences. When requested, the lists of current catchwords/phrases my colleagues come up with have some overlaps and quite a lot of differences. Moreover, if I ask them to put their five choices in order (such as, more to less popular), the orderings are often different. We may say that perceptual frequency estimation is robust to the extent that there are overlaps and some similarity in orderings. It may be possible to enhance the robustness of perceptual frequency estimation by asking my colleagues to have a look at each other’s lists and agree upon one list – to come up with a consensual listing.
I have a strong interest in perceptual frequency estimations and consensus building. They are methodologically very useful, for reasons that I will come to in a later essay.
Among my colleagues, those who are accustomed to methods for interpreting specific integral texts are inclined to be content with perceptual frequency estimations. However, those who are accustomed to methods for analysing collections of texts as word/discourse corpora are generally dismissive of such estimations. They also tend to be contemptuous about those who take them seriously. They prefer what we may dub empirical frequency measurement.
There are now various norm-laden and rather spurious binaries with slightly different nuances to express this dismissive attitude, such as subjective knowledge/objective knowledge, qualitative method/quantitative method, soft science/hard science. In diplomatic mode, one may occasionally be told that both sides are of equal methodological value. In all honesty, one is constantly given to understand that perceptual estimation is subjective/qualitative/soft science, and of a lower order of methodological value than the objective/quantitative/hard science approach to empirical measurement. The McNamara fallacy is rife among researchers and academics.
Under the pressure of this normative attitude, various routinised modes of being quantitative with qualitative materials, deriving an objective quotient from subjective observations, being hard with soft data have developed. In my view, these modes are usually not happy syntheses. They are adopted to give the subjective/qualitative/soft a misleading appearance of being objective/quantitative/hard. Various problems reside in those routinised developments, to which I will address a separate essay.
Empirical Frequency Measurement
I have a keen interest in empirical frequency measurement.
The obvious way to go about this is to:
- take a word/discourse corpus of some size;
- use a standard scale (per centage is common) to work out how often a word/phrase was used relative to all the words in the corpus (i.e., that word’s/phrase’s usage-frequency) at consecutive regular points in time (let’s say, at daily/monthly/annual/decadal intervals);
- draw a graph of the usage-frequency of that word/phrase [x-axis] in relation to consecutive regular points of time of a period [y-axis].
If the graph shows a notable and steady upward curve over a significant time-period for a word/phrase, we may say that we have a measurement for that word/phrase ‘catching on in a significant manner’ – so, that is a catchword/phrase for that time-period.
A popular catchword/phrase (in the terms given earlier) might be trackable in a large language corpus for a given language (e.g., a corpus for general English usage).
The most accessible facility based on a large corpus for obtaining such graphs is the Google Ngram Viewer. It draws upon the Google Book corpus of around 200 billion American and British English words. The various grey areas of the facility notwithstanding (see e.g., Pechenick et al. 2015, Younes and Reips 2019), this offers immediately processed graphic representations of patterns of usage-frequencies over time for words/phrases. For ease of discussion, let me confine the rest of this section to words that catch, and put catchphrases aside for the time being – while noting that, usefully, the Google Ngram Viewer can be used for word as well as (with some limitations) phrase graphs.
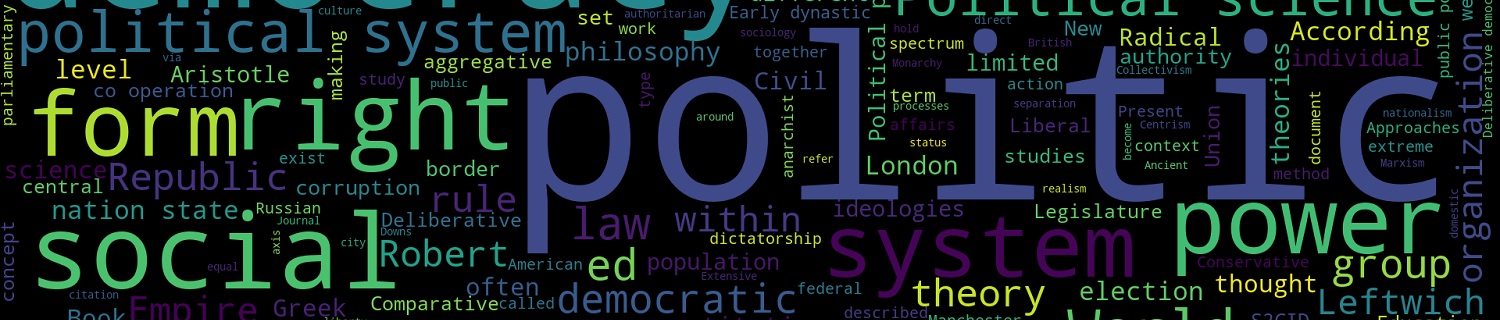
To read graphs like Google Ngrams meaningfully, some orientation with word usage-frequency measurements is needed. A listing of a small selection of common words across a range of usage-frequencies could be used as an orientation tool. Since this project blog concerns political catchwords/phrases, I have made such an Orientation Table for my own use -- you will find it linked here as an Orientation Table of Usage-Frequencies for Selected Words (mostly with political associations). This may help you to get a sense of what usage-frequency measurements look like for various more or less common words – at any rate, I have found it helpful. I will devote a separate essay to what political refers to in this project.
The Orientation Table gives two kinds of usage-frequency measurements for the chosen words in the left-hand column.
- In the middle column is a snapshot of the usage-frequencies of those words (per centages relative to the relevant total corpus) at the beginning of 2018, drawn from Google Ngrams. Since the per centage figures are in 10 decimal points after zero, they are difficult to read – so, I have organised them in descending order, and colour-coded for 0.n, 0.0n, 0.00n and so on.
- The other kind of usage-frequency measure for those words, in the split right-hand column, are very rough average usage-frequencies of those words over all time (in rounded numbers of occurrences per million), taken from the online Oxford English Dictionary (OED). For these, the OED also draws upon the Google Books 1500-2010 corpus and other corpora. Usefully, the OED divides these rough figures into eight Bands from low to high usage-frequency (Band 1 to Band 8), see the Table and discussion of the Bands in the OED explanation of its frequency figures. The Bands in the OED of average rounded usage-frequencies for all time are analogous to the colour-coding in my Orientation Table of the snap-shot usage-frequencies at the beginning of 2018 from Google Ngrams.
Contemplating the relationship between the 2018-snapshot figures and the all-time averages could help towards building a kind of mental map in terms of which to read usage-frequency graphs.
In the OED explanation it is observed that the higher usage-frequencies (i.e. higher Bands) are found for a relatively small number of words. Only 5.20% of all words in the OED have a usage-frequency of 1 and above (>1) occurrences per million, in Bands 6-8. The catchwords that are likely to come up in our time are very likely to be in the area of Bands 1-3 (<0.099 occurrences per million).
However, it does not really matter which Band the word in question is. The point of catchiness is not how frequently the word is used in relation to a total corpus size, but about how much and how quickly it catches. So, a catchword can appear as such at any level of usage-frequency, as much in the range of OED’s low usage-frequency Band 2 as of the high usage-frequency Band 5. It is the significant increase in usage-frequency that is relevant, not the OED Band of usage-frequency.
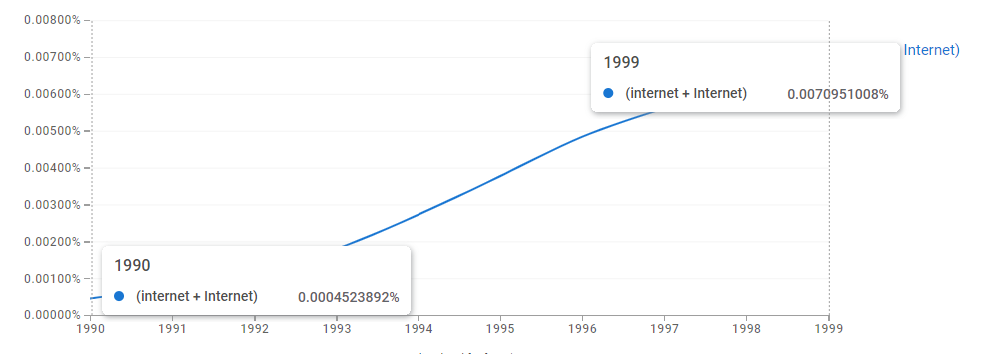
The increase in usage-frequency over a time-period appears in a Google Ngram graph as follows. To exemplify, I track the word ‘internet’/‘Internet’ between 1990 and 1999. Note that the steady growth, characteristic of catchwords, appears (at smoothing 3) as a logistic curve and occasionally as an exponential curve.
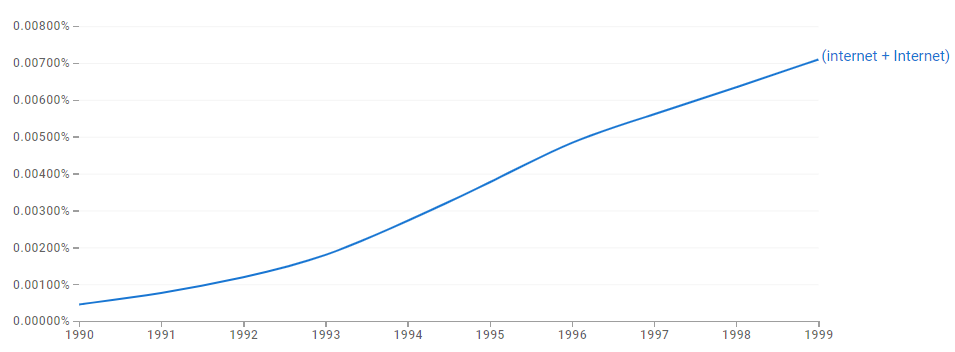
Google Ngram for ‘internet+Internet’, 1990-1999
Google Ngram for ‘internet+Internet’, 1990-1999
And here it is again, with the percentage usage-frequency at the beginnings of 1990 and 1999 marked
This graph shows that the usage-frequency for the word ‘internet’/‘Internet’ increased over 15-fold in the course of the decade. ‘Internet’ could be regarded as a wildly popular catchword of the 1990s. In general, insofar as Google Ngram indications go, I have it as a rule of thumb that: a popular catchword/phrase will usually show approximately a two-fold increase in usage-frequency in or in less than a 10-year time-period (≤ 10 years). This is a rule of thumb and not innately meaningful. The boundaries of doubling within a decade are based on convenience and my experience rather than an inherent rationale; other boundaries may well work better.
A very large corpus like Google Books is unlikely to be helpful for measuring catchwords/phrases which are more extensive than intensive (like organizational catchwords/phrases) or more intensive than extensive (like in-group catchwords/phrases). For those, the corpus needs to be delimited by organizational or in-group domains. To track the significant catching on of words/phrases according to domains:
- either the large corpus needs to be annotated so that it can be delimited for those domain-parameters,
- or customised corpora need to be built for those domain-parameters, either by direct text collections from or by capturing text from the digital facilities of the domains in question.
Why?
Perceptual frequency estimations and empirical frequency measurements could serve to identify catchwords/phrases and to put them in some scheme/order. They indicate what words/phrases have caught on and to what extent – i.e., what the catchwords/phrases are. But they say little about why they have caught on. Without considering methods for addressing the why-question very little can be done by way of studying catchwords/phrases.
In this respect too, judicious attention to usage-frequency measurements could take one some of the way – but, it seems to me, not far enough. Perceptual estimations and the process of getting to consensuses may well be able to take one further.
Methods for addressing the why-question call for several essays.
First Inset image: Wolfmann, CC BY-SA 4.0 via Wikimedia Commons


Explore

Undergraduate
Postgraduate
Policy
-
Follow us on Social media
-


